Google’s Core Web Vitals are no longer just “nice to have.” They’re baked into how your site ranks, how users experience it, and how AI agents interpret it. If you’re building in Webflow, you already have a performance advantage (clean code, native optimizations), but that doesn’t mean you’re guaranteed good scores.
The good news is, with the right setup, you can consistently hit “green” across all three metrics: LCP, INP, and CLS.
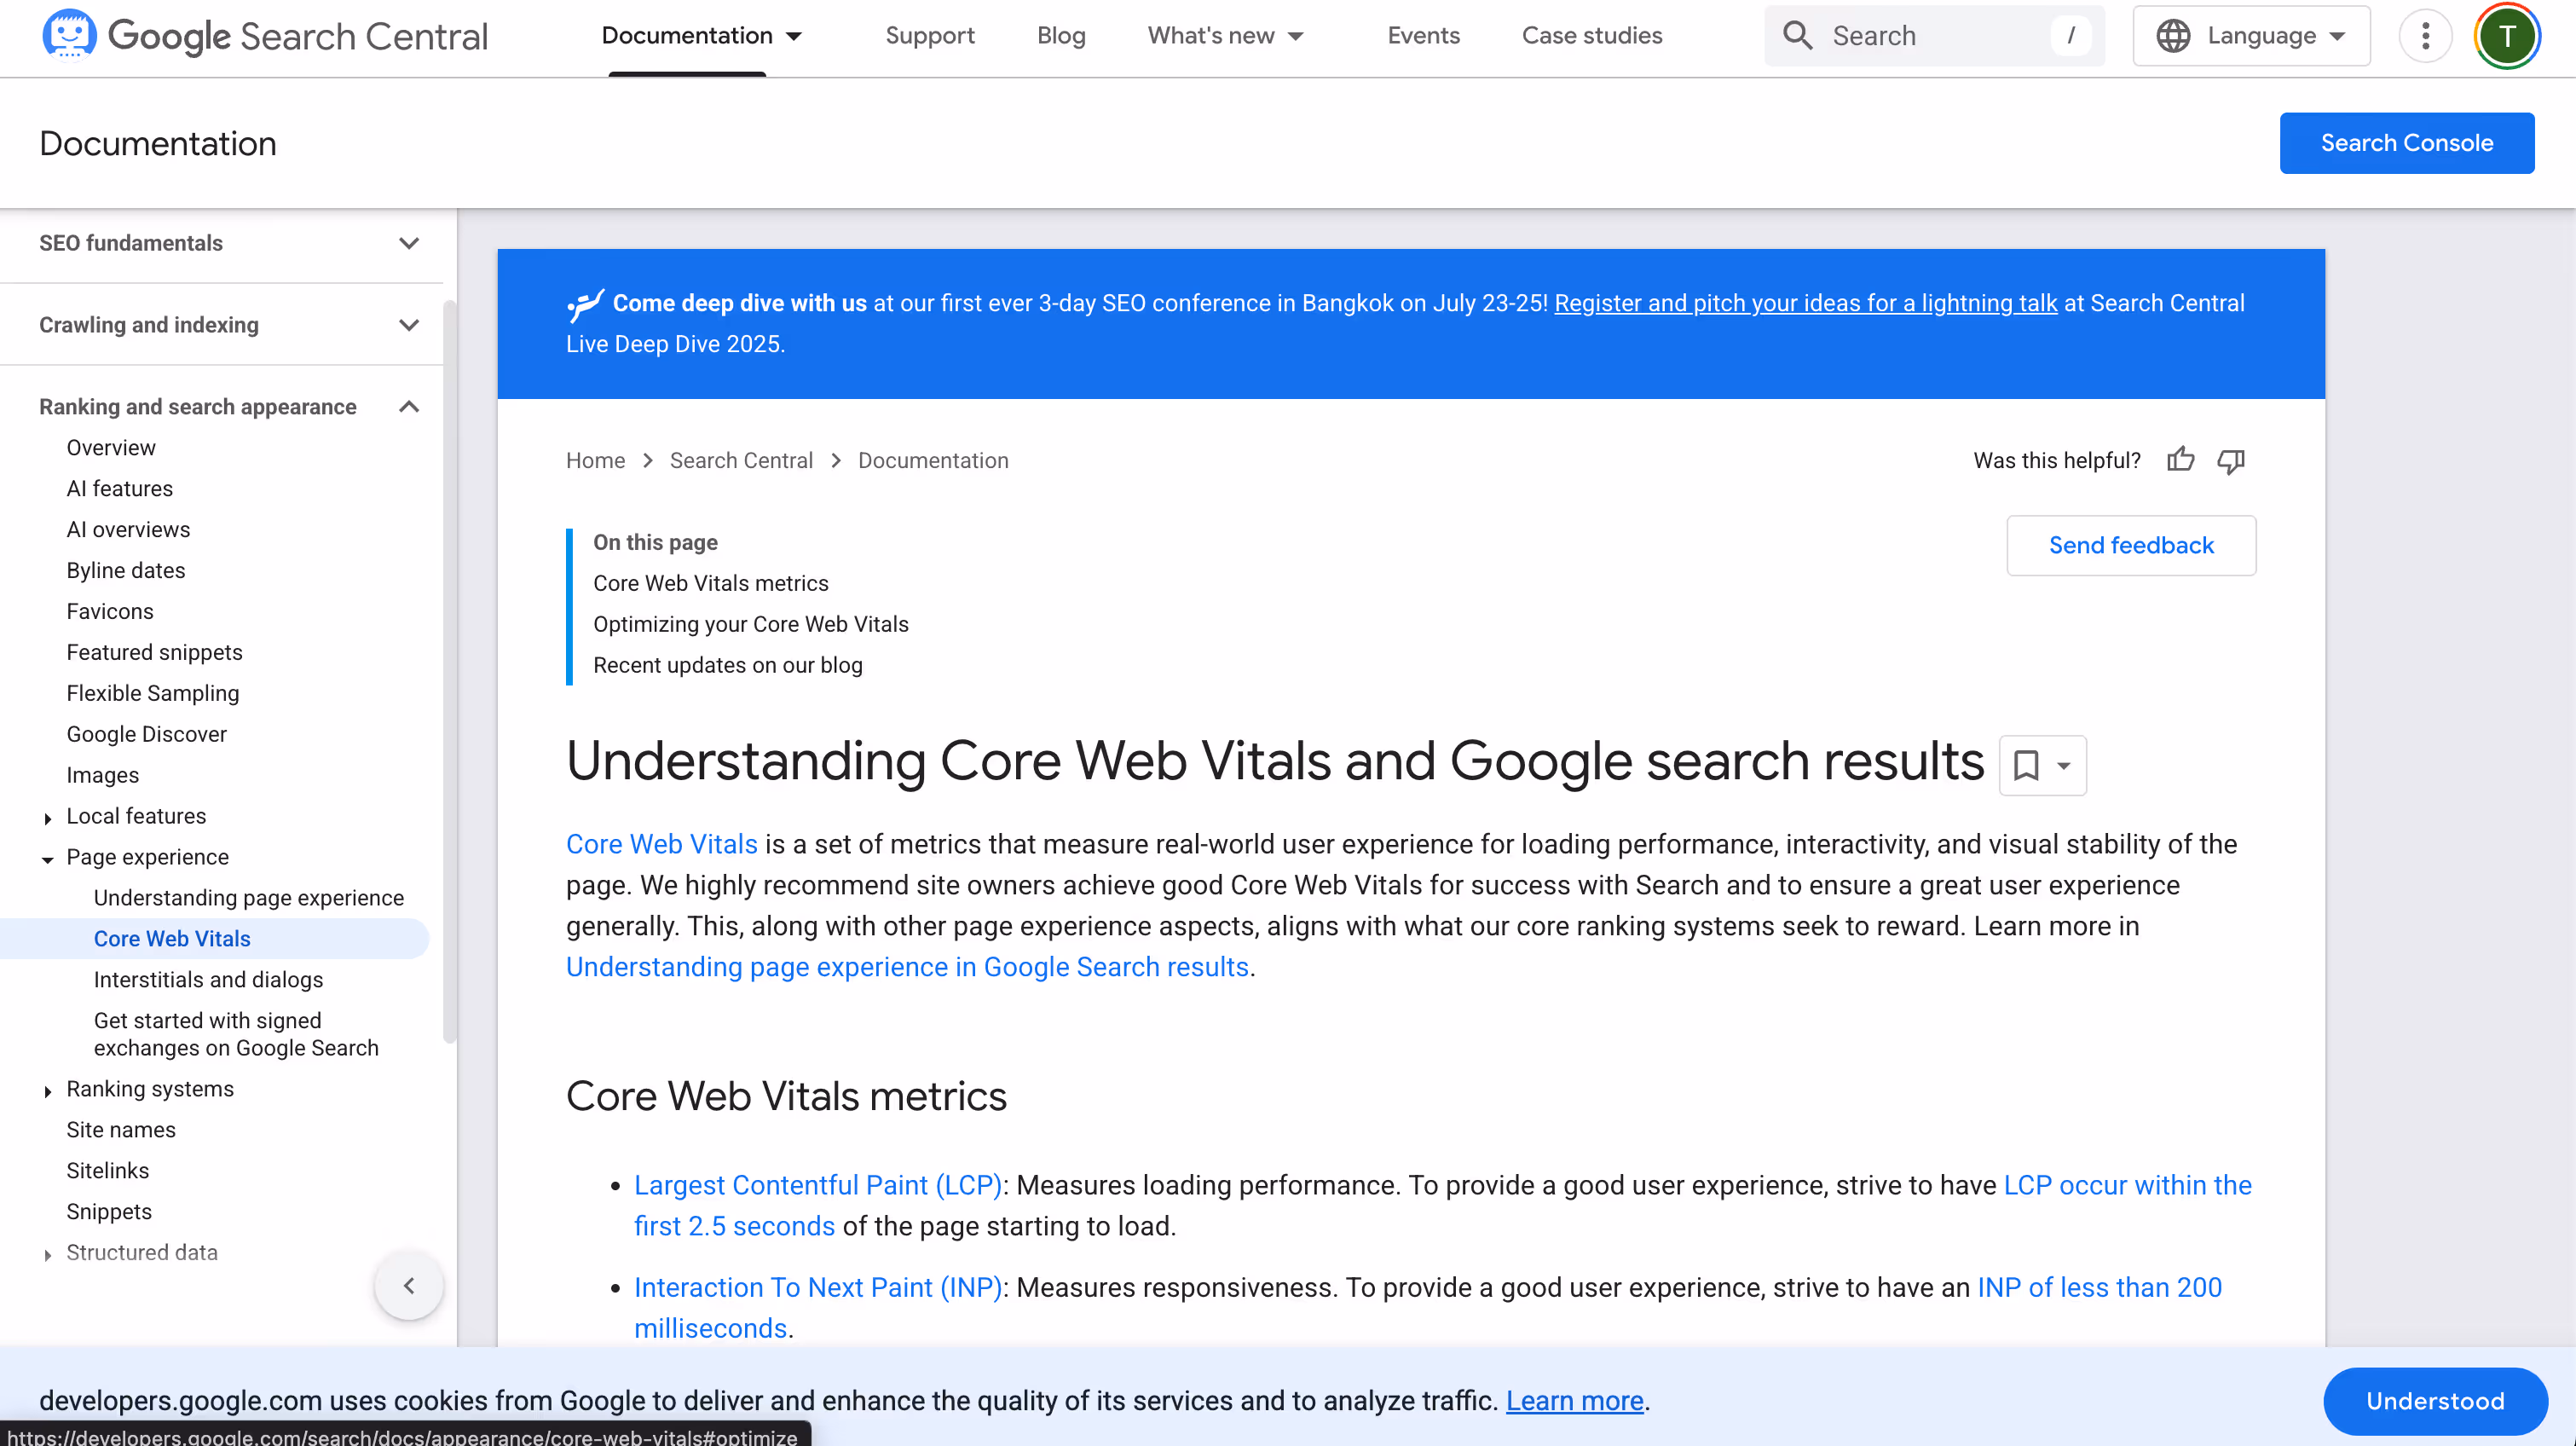
The Three Core Web Vitals
Largest Contentful Paint (LCP) – how fast your main content loads.
- Good: ≤ 2.5 seconds
- Needs Improvement: 2.5 – 4.0 seconds
- Poor: > 4.0 seconds
Interaction to Next Paint (INP) – how quickly your site responds to interactions like clicks, taps, or key presses (this metric replaced FID, First Input Delay, in 2024).
- Good: ≤ 200 ms
- Needs Improvement: 200 – 500 ms
- Poor: > 500 ms
Cumulative Layout Shift (CLS) – how stable your layout is as it loads.
- Good: ≤ 0.1
- Needs Improvement: 0.1 – 0.25
- Poor: > 0.25
In this post, we’ll break down a practical checklist tailored for Webflow teams.
.avif)
Why Core Web Vitals Matter
- SEO: Google explicitly uses them as a ranking signal.
- User Experience: Faster, more stable sites reduce bounce rates and improve conversions.
- AX (Agent Experience): Smooth performance makes your site easier for AI agents and crawlers to parse.
How Core Web Vitals Data Is Collected (and Why Consistency Matters)
Core Web Vitals rely on real user data, known as field data or Real User Monitoring (RUM), to gauge actual site performance in real-world scenarios. Google uses this for both ranking signals and performance reporting tools like Search Console, PageSpeed Insights, and the Chrome User Experience Report (CrUX).
Key facts about how it's collected:
- Source: Data comes from Chrome users who have opted into usage statistics, are synced with Google accounts, and do not use a sync passphrase.
- Aggregation: Google assesses performance using the 75th percentile—meaning 75% of page views must meet the “good” thresholds (e.g., LCP ≤ 2.5s, INP ≤ 200ms, CLS ≤ 0.1) to be considered optimal.
- Time Frame: These metrics are aggregated over a rolling 28-day period. Tools like PageSpeed Insights and Search Console typically reference the last 28 days of data.
- Eligibility: Individual URLs must have enough user visits to show URL-level metrics. Otherwise, only the aggregated origin-level (domain-wide) data is available.
What this means for teams working in Webflow:
- Ensure sufficient traffic to key pages so meaningful field data can be collected.
- Track performance consistently. A single good lab test doesn’t suffice—real user data averaged over time is what matters.
- Use both RUM and lab tools. While RUM reflects real impact, lab tools (like Lighthouse) help isolate issues during development or staging.
The Optimization Checklist
1. Optimize Images and Media
- Use WebP or AVIF exports where possible.
- Take advantage of Webflow’s built-in responsive image generation.
- Compress manually before upload—don’t rely only on Webflow.
- Lazy-load non-critical images, especially below-the-fold visuals.
2. Control Fonts
- Limit the number of weights and styles (e.g., Light, Regular, Bold instead of 6+ variants).
- Consider system fonts for speed-critical UI elements.
- Host Google Fonts locally in Webflow to cut external requests.
3. Manage Scripts and Embeds
- Audit third-party scripts (chat widgets, analytics, A/B tools).
- Load non-essential scripts after user interaction or via defer.
- Use Webflow’s “Before </body>” field for scripts so they don’t block rendering.
4. Stabilize Layouts (Prevent CLS)
- Always set width/height attributes for images and videos.
- Reserve space for dynamic elements (ads, embeds, popups).
- Avoid shifting buttons and CTAs with late-loading fonts or banners.
5. Improve First Input Delay / Interaction to Next Paint
- Minimize JavaScript-heavy animations.
- Use Webflow Interactions sparingly and prioritize purposeful motion.
- Replace unnecessary libraries with native Webflow features when possible.
6. Optimize Hosting & Delivery
- Use Webflow Hosting—it’s already powered by AWS & Fastly CDN.
- Enable SSL for every site.
- Keep domains, DNS, and redirects clean to avoid lookup delays.
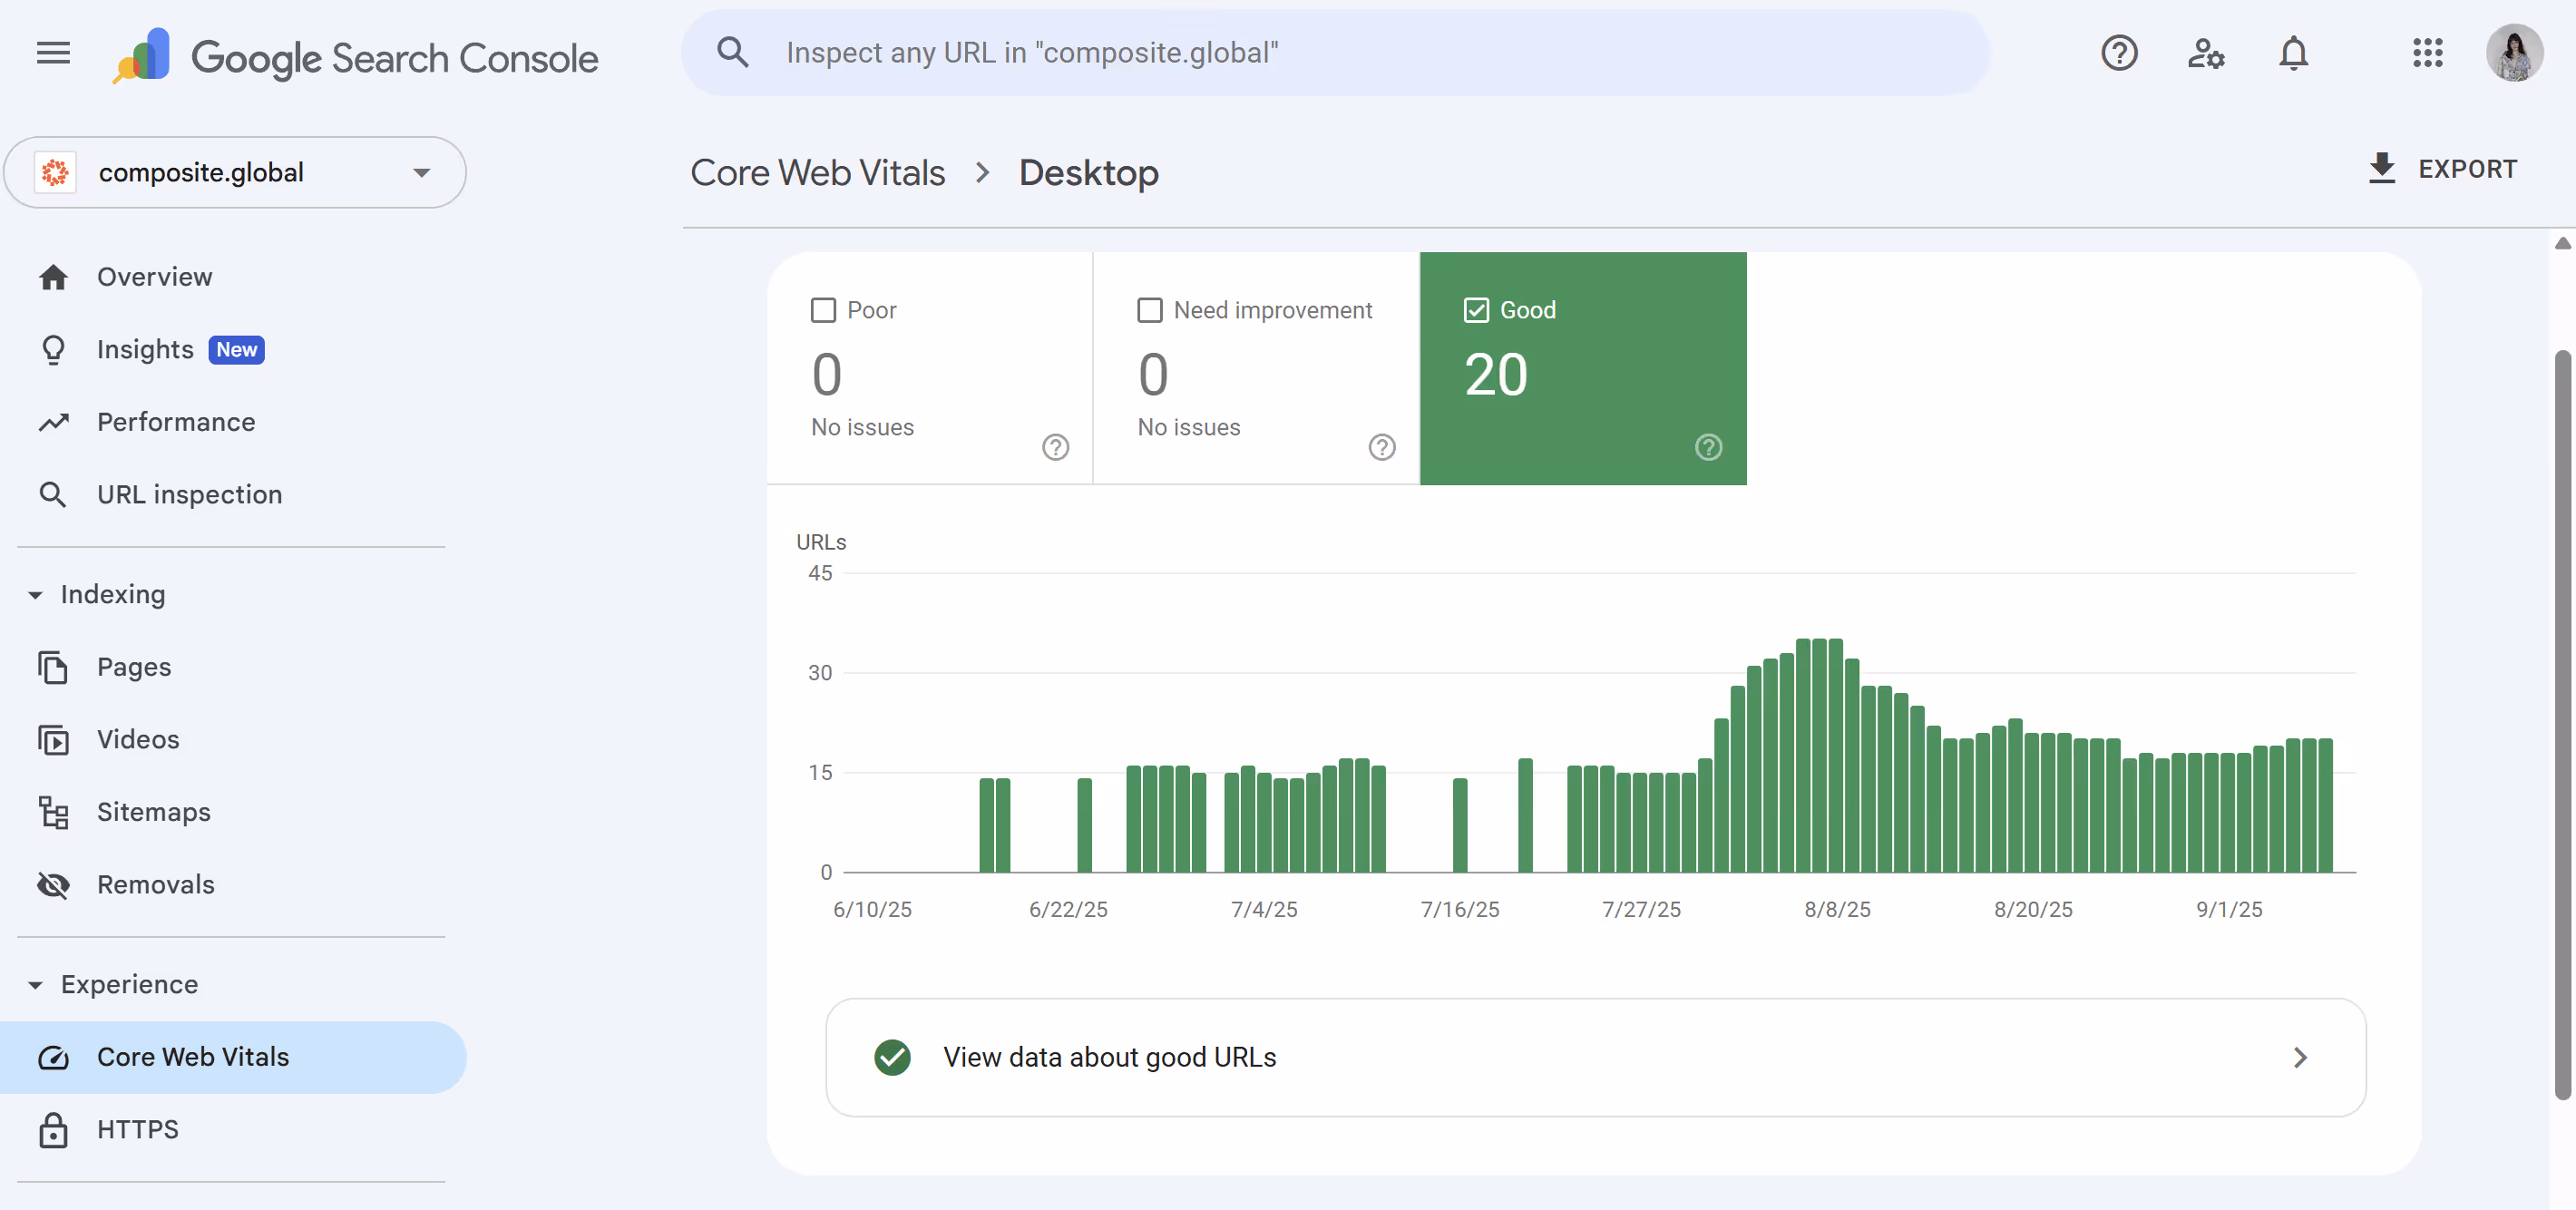
7. Test and Monitor Continuously
- Use Google Lighthouse and PageSpeed Insights for lab tests.
- Validate with Search Console’s Core Web Vitals report for real-world data.
- Re-test after adding new animations, embeds, or heavy assets.
Common Pitfalls in Webflow Builds
- Uploading 5MB+ hero videos with autoplay.
- Using multiple third-party embed codes for features Webflow already supports.
- Loading entire font families “just in case.”
- Designing for desktop first and ignoring mobile LCP.
Core Web Vitals as Part of AX Strategy
Core Web Vitals aren’t just about human visitors. They also influence how AI agents (AX) parse and act on your site. A fast-loading page with stable layouts and responsive interactions is easier for machine systems to understand, summarize, and recommend. In other words, good performance benefits both your users and the agents increasingly navigating the web on their behalf.
Digital Solutions: Core Web Vitals in Webflow
Optimizing Core Web Vitals in Webflow is about working smarter: leveraging Webflow’s native strengths, removing bottlenecks, and layering in best practices. The payoff is huge: stronger SEO, happier users, and better discoverability across search and AI ecosystems.
At Composite, we’ve helped teams improve their Core Web Vitals during migrations and redesigns, ensuring performance is baked into the process from day one. If you’re ready to take your Webflow site from “good” to “green,” let’s talk.